


eLumen Program Review Instructions
DISCLAIMER: The contents of this help file were created by Research and Planning, and are focused on use of the eLumen application. This is not meant as a strategy guide, nor a best practices, as frankly only you know what is best for your own programs. We have though tried to offer some documents from our faculty, and other institutes, to help understand the questions being asked. If you have edits, advice, or content for this page, please send them to palmerj@mjc.edu for inclusion.
Thank you, Research and Planning, 2017.
Understanding the Program Review Process, by Curtis Martin, PhD., Program Review Faculty Advisor.
The Program Review Process (Apr 2017 draft document)
Part 1 - Program Overview
Awards
The eLumen system can pre-populate the awards offered in your department by clicking
the generate button. This button will not appear if you are not assigned the role
of contributor. To confirm you are a contributor, click the People ![]() icon.
icon.
For each award, please add if it is being included in this review (yes/no) and if the program has external regulations (yes/no.) These would be state mandated regulation like licensing, reporting, and such.
Additional comments or clarification can be added in the text box below the program awards table.
The Mission of Modesto Junior College
Here you will give a brief explanation of your program, and explain how your program advances the overall mission of Modesto Junior College. In addition, as the first narrative of the document, this serves as a report abstract for readers. As there is not an integrated spell checker, you are encouraged to use Word or other word processing programs to prepare this, then copy and paste the content in, with most formatting preserved.
Response and Follow-Up to Previous Program Reviews
As part of the continual improvement process, you are asked to address the comments and recommendations left during the previous program review. Research and Planning has attempted to collect these together here to to aid in retrieval. If the wrong file was retrieved, or it is missing, please refer to Curricunet Program Review archives. It is expected that a program has read, analyzed, and implemented needed changes based on the Previous Response to Program Review from their immediate supervisor, the Instructional Council, and the Assessment Workgroup. Programs should use this section to provide analysis and data regarding assessment, faculty hires, utilization of resources granted previously, etc.
With the second part of this question, program and faculty can show their professional development activities, program and faculty involvement in the community and college, etc. This category allows programs and program faculty to shine a light on curricular and extra-curricular successes and community links – this is truly a place for public relations (PR) in your program review (PR).
Example: “Members of the XXX Department have actively participated n the college’s assessment and improvement efforts. The program has identified, publicized, assessed, and reviewed its Student and Program Learning Outcomes. Subsequently, the program has engaged in the kind of informed dialogue that has contributed to meaningful improvements in the program. We have also made college-wide contribution; members of our program are currently serving on MJC’s curriculum committee, the Course Identification Numbering System (CI-D). Additionally, our faculty are also engaged in leadership roles in the Student Equity Committee, the college’s Honors Program, the Academic Senate, and the Assessment Committee.
In addition to staying current in their fields, executing regular curricular duties, and participating in department, division, and college-wide participatory governance efforts - members of the department have served as follows: XYZ served as division representative to XYZ Committee, served on a hiring committee for the division’s dean, served on the division’s ad hoc Share Governance committee, advised students, served as the Faculty Liaison for the XYZ Center, and served the community actively in the XYZ Unified School District and Girl Scouts of America. ABC coordinated the department’s scheduling, participating in the evaluation of adjunct faculty, coordinated the college’s ABC Program, trained and served as a mentor for online instruction, participated in the state Course Identification System (C-ID), and volunteers for the college’s Friends of Music. “
Math and English, with large number of faculty, would find it tedious to include a
description of each faculty member in this section. However, it is recommended that
large programs find ways of describing their program and faculty contributions to
the college and the community. For example, publications, attendance to conferences,
professional development activities, etc., should be quantified in this section.
Part 2 - Student Achievement and Completion
Part two begins the data analysis portion of the program review. Due to complexity and scope you will be viewing a variety of different charts and figures. For many you will need to use the drop down menus to focus on your individual program. Each level of filtering will reduce the list of the next menu, e.g. selecting MALHE division will reduce the department menu to just those in that division. If the expected items are missing from a menu, verify that the menu "above" has the correct selection.
Success
 The success dashboard tracks student's successful completion, census counts, and awards
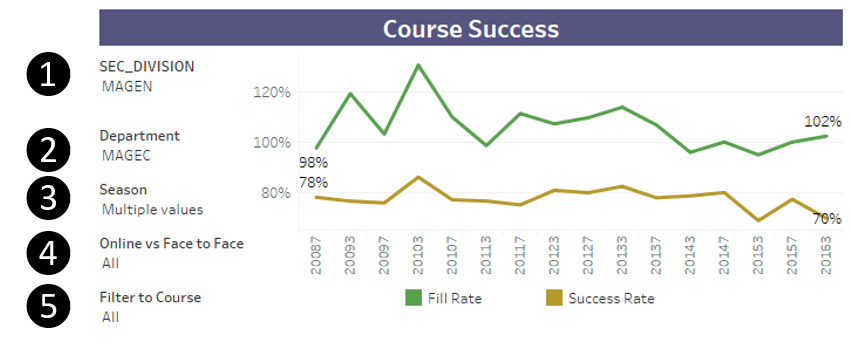
conferred. Start with the first tab, Success, and filter the chart to the division
(1), then filter the department (2). The season filter (3) is available to view only
specific terms; fall, spring, summer; on their own. The Online vs Face to Face (4)
drop down will filter traditional versus online courses. This will enable you to
compare like sections for trend changes. Lastly, use the final drop-down, Filter to
Course (5), if interested in a single course. Use the previous division/department
selections to reduce the courses shown on the menu.
The success dashboard tracks student's successful completion, census counts, and awards
conferred. Start with the first tab, Success, and filter the chart to the division
(1), then filter the department (2). The season filter (3) is available to view only
specific terms; fall, spring, summer; on their own. The Online vs Face to Face (4)
drop down will filter traditional versus online courses. This will enable you to
compare like sections for trend changes. Lastly, use the final drop-down, Filter to
Course (5), if interested in a single course. Use the previous division/department
selections to reduce the courses shown on the menu.
Course Success Line Chart
The first graph illustrates the fill rate and success rate trended over time. The horizontal axis uses a year / term code, where a four digit year is used, followed by a single digit term, 3 for Spring, 5 for Summer, and 7 for Fall. The values shown stretch back to 2008 Fall (20087). The fill rate is calculated by the number of students enrolled at census, divided by the total of the course section capacity listed in Datatel. There has been an overall trend towards larger class sizes, which may explain a falling fill rate, rather than a drop in popularity. This can be confirmed in next table. The Success Rate line illustrates the number of students receiving a passing grade (typically credit awarded, or C or better, including Pass) divided by the census number whom enrolled in the course. Hovering over any point on the line chart will bring up a window explaining the data point.
Course Success and Fill Table
The data table is provided for validation of trends seen in the line chart. Here you can verify if fill rates are dropping due to capacity changes or census enrollment. This chart is controlled by the filter menus above, so ensure those menus reflect what you wish to analyze.
Course Success - "Box and Whiskers" box plot chart
The final chart on this tab reflects each course's success rates, with each dot representing one section of that course. The box portion shows the median/average of all sections, shading showing those in the quartile below and above average. The outer lines are the bottom and top quartiles, or "whiskers", and further out dots representing sections on the extremes. Analysis of this chart will show the "spread" of course success rates by section, too wide of a span may represent inconsistent teaching expectations. Over over a "box" to view the different quartile percentages, while hovering over a single dot will show the course title, term, time of day, and rate.
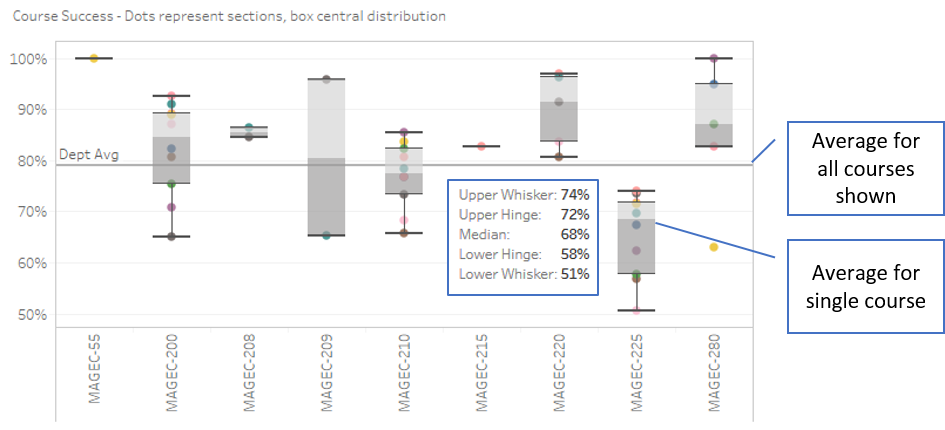 In the example shown, AGEC-225 is shown to have an average below the lowest quartile
of other sections in the department. The spread on the same course is shows a range
of 51% to 74%, a range on par with other courses. Knowing this course to be offered
both online and face-to-face, switching the drop-down menu 4 to face-to-face reveals
a different picture, with the average of the two sections averaging 87%, to 64% otherwise.
Further, removing the filters to division and department, while retaining the online,
reveals 64% to be about average for online classes overall. This can then be used
to lead discussion on reducing the gap for DE, changing online teaching methods or
content, or if additional face-to-face class sections should be offered.
In the example shown, AGEC-225 is shown to have an average below the lowest quartile
of other sections in the department. The spread on the same course is shows a range
of 51% to 74%, a range on par with other courses. Knowing this course to be offered
both online and face-to-face, switching the drop-down menu 4 to face-to-face reveals
a different picture, with the average of the two sections averaging 87%, to 64% otherwise.
Further, removing the filters to division and department, while retaining the online,
reveals 64% to be about average for online classes overall. This can then be used
to lead discussion on reducing the gap for DE, changing online teaching methods or
content, or if additional face-to-face class sections should be offered.
Student Equity Gap Question
The last question of this section asks you to identify differences across student populations. Click the Equity Tab at the top of the dashboard to view by demographic groups. Please note that the filters are not retained from the earlier tab. You will need to re-select the division, department, and other items to view an identical data set. By default, only the years being currently reviewed are selected. Additional years can be added through the academic year drop-down menu. The first chart reveals the success rate of the selected courses by declared ethnicity, with the column height representing the success rate, and the score above, the total number of successful students. Very small sample sizes may not be "mathematically significant" but still may represent an overall trend that needs to be addressed. Removing the department filter, or both division and department, can help identify an overall issue. Additional charts all focus on success rates, though comparing them versus gender and modality of the course.
Once focused on your department, please look for large differences, or gaps, between top performing groups and others. Consider how you could identify the reasons behind these gaps, and if there changes that could be made to reduce them. For in depth review of equity issues, and on changes that are being made campus-wide, please refer to the current Student Equity Plan.
Conferred Award Trends
There are two tabs of reports focused on Awards (degrees) conferred, one is overall, the other is disaggregated by demographics. Use either the drop-down menus for division / department / program, or simply select the desired element in the first table, which will filter the report. Selecting it again will remove the filter. By default the years covered by the is review are selected, additional ones can be chosen for trending by using the drop-down Academic Year menu near the top. If the incorrect data, or nothing is shown, verify the drop-down menus are set to the correct departments. After reviewing the number of degrees, and certificates awarded, click the Awards by Demographics tab. Here you can review by gender and ethnicity. The questions for this section ask you to set a aspirational goal for degrees for your programs, then consider what efforts will be needed to meet these goals.
College Goal for Student Achievement: Increase Scorecard Completion Rate for Degree and Transfer
Part 3 - Student Learning Outcomes
The learning outcomes portion brings together your departments work in mapping the levels of Learning Objectives from the course, to the program, to the institute.
PLO / ILO / GELO Outcomes
To ease in analysis, trending charts have been created by Research and Planning on the Dashboard portion of this website. Using these charts you can identify your current success rates in student achievement towards the outcomes. Considering your current success rates, and previous semester, set a department aspirational goal, and what your success rate is currently. Later you will be asked to outline a plan to achieve this threshold, but for now, simply supply the Goal % and Current % for each level.
Note: If the dashboards do not show your Learning Outcomes, please ensure that they have been mapped in eLumen. Each course will need to be mapped to each program's outcomes, and they in turn to the Institute and General Education, if any, outcomes. Much of the work has already been completed over the past few years, and now just needs to be done in eLumen. The Outcome Assessment Workgroup has created a web page detailing the work already done -> PLO, GELO, and ILO Assessment grids. While not detailing the use of eLumen the 2013 SLO Manual may help in understanding why we map, and what the different levels mean overall. For additional assistance, review the Course Learning Outcome Assessment web pages, or contact Nita Gopal at gopaln@mjc.edu.
Continuous Quality Improvement
This is the place to address your plans for meeting the goals you set in the previous questions. Feel free to paste text in to this box, and do not worry about the size of the box, as it can contain large narratives if needed. If you have diagrams, charts, or other supporting information you would like to include there are two methods to do so; create image files of the attachment, then use the insert image action on the menu bar, or simply email the documents to Research and Planning, with instructions as to where to include them.
Equity and Success
For this last question of part 2, please return to the learning objectives dashboards, and look to the breakdowns by ethnicity. Here you are being asked to identify any Equity Gaps, that being the difference in achievement between the highest performing ethnic group and all others. Here's a resource by our own Al Smith on Student Success and Equity (2015) with great resources in understanding how to address this question. While the initial data sets now available are focused on ethnicity gaps, other disadvantaged groups (Foster Youth, Veterans, Low Income) reporting will be added shortly.
Resource Request and Action Plan as Related to Student Learning Outcomes
First, please click Save draft before continuing!
There are two parts in the program review to request resources, one for those what advanced improvements to student learning outcomes, and the other addresses program improvements as a whole. The resource request portion opens a different part of eLumen, an "action plan" where you can identify the needs, then offer a narrative as to how the resource request will help you attain your target goals. These items will be ranked, so group together items that "go together", while standalone or separate initiatives should likely be entered on their own lines.
Part 4 - Curriculum and Course Offerings Analysis
The curriculum and course analysis section addressed two areas, course compliance, planned program expansion, and consideration as to where and when sections are being offered.
Curriculum Analysis
Courses are required to be reviewed on a five-year cycle. Since eLumen does not have our course review records, Research and Planning has compiled the courses that need to be reviewed, these can be seen on your departmental page for program reviews. Feel free to compose the narratives in another word processor, and paste the results here; most formatting will be retained. If you have diagrams, charts, or other supporting information, you would like to include there are two methods to do so; create image files of the attachment, then use the insert image action on the menu bar, or simply email the documents to Research and Planning, with instructions as to where to include them.
Course Time, Location, and Modality Analysis
The Course Attributes dashboard
Part 5 - Program Analysis
Program Personnel
Faculty Assignments
Departmental Productivity Measurements
Part 6 - Long Term Planning and Resource Needs
Long Term Planning
Student Achievement & Overall Program Review Resource Requests
Part 7 - Appendix
Optional Questions
Review Process Feedback